
In psychology, the ego plays a significant role in our psyche. It builds the foundation of our self-concept and is a crucial part of our cognitive function. However, the ego is seen as an obstruction in the spiritual path. A…
Connecting with yourself through spiritual healing
At Spirit Restoration, we are guided by the belief that a spiritual life is a happy life. When you are in tune with your spirit, it leads to a change in perspective. You become more connected to yourself, the people around you, as well as your environment. You become more mindful, and kindness and inspiration flows from you like water.
This is the power of spirit healing. It changes your life and the way you see life itself. You are inspired to live better, be kinder to yourself and others, and cultivate kindness, positivity, and inspiration.
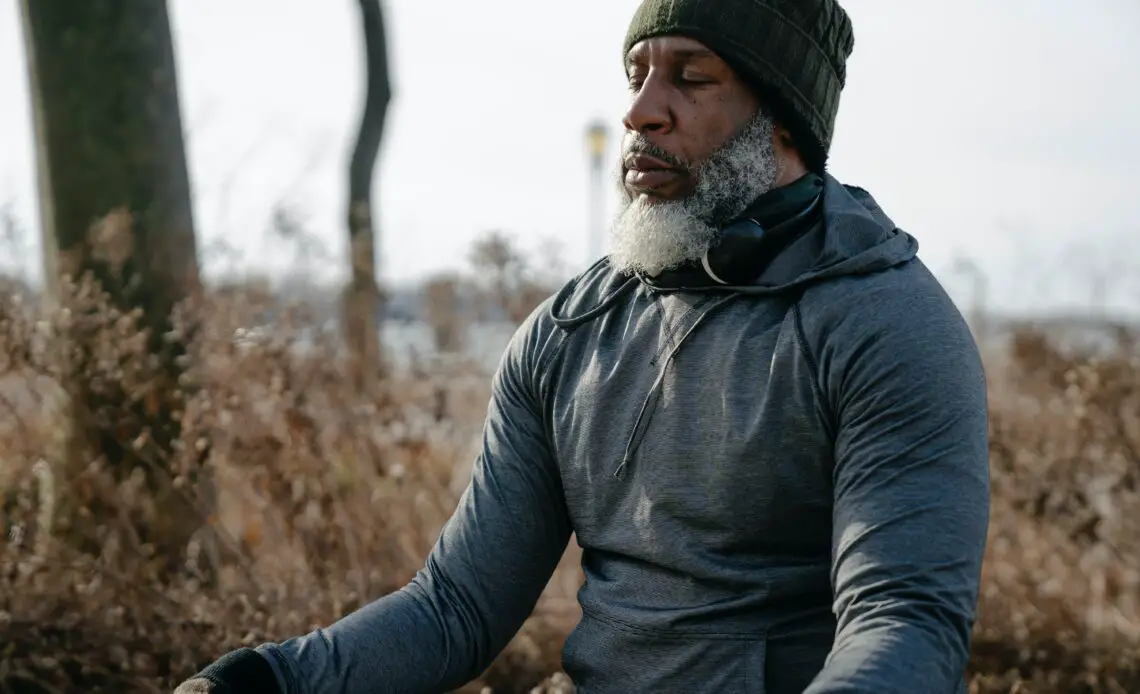
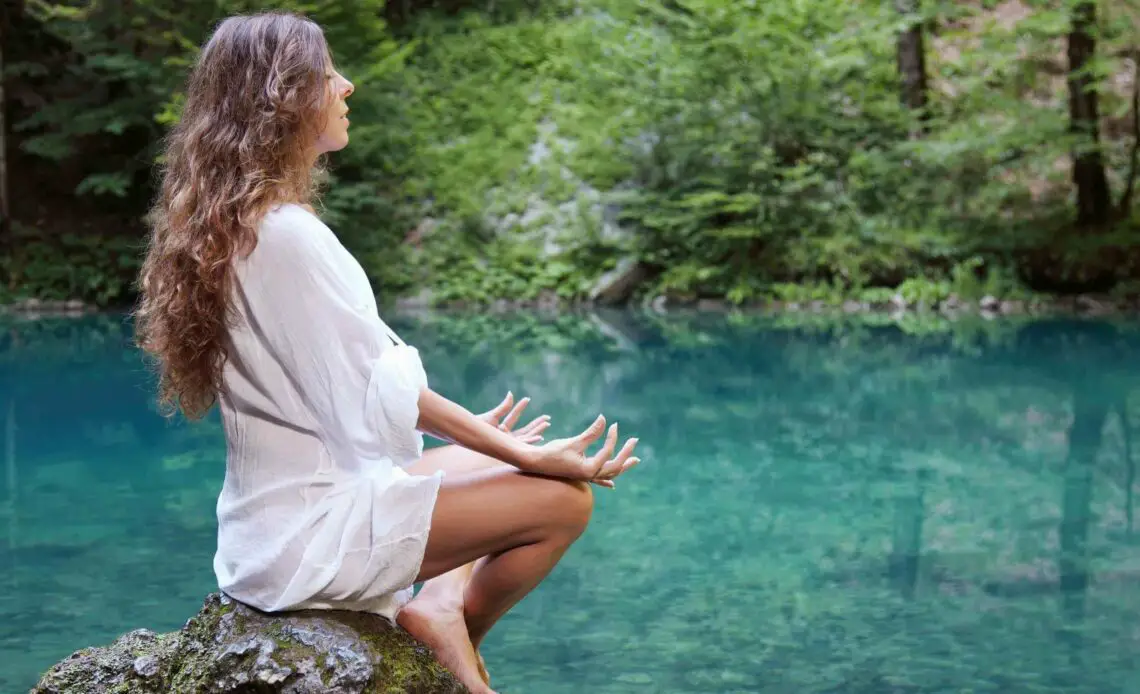
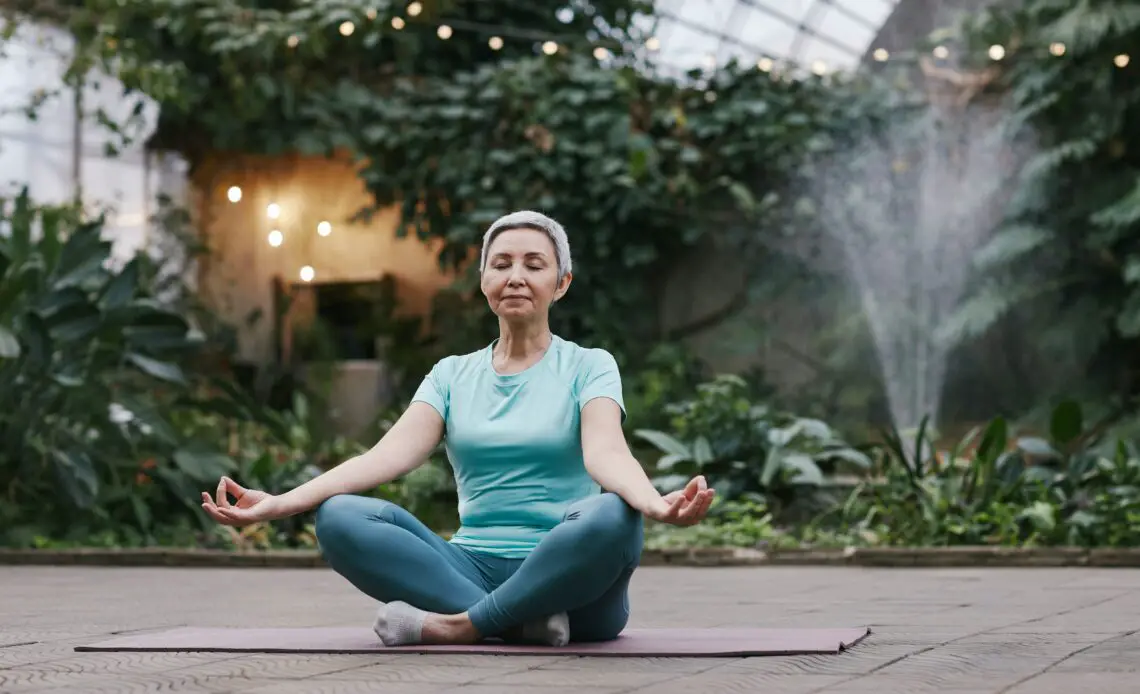
Spirit healing often involves, but is not limited to, certain activities such as eating healthy, praying regularly, practicing yoga, meditation or any other kind of exercise that brings you peace, paying attention to your mental health and practicing mindful living, being an active member of your community, and more.
Is spirituality the same as religion?
One common question that many people have is whether spirituality is the same as religion. Spirituality is not the same as religion. Regardless of your religious background, you can practice spirituality freely.
A Christian, a Buddhist, a Muslim, or a Hindu can practice spirituality while still remaining true to their religion. Spirit healing is a personal journey that is uniquely yours and no one can tell you how to experience it. If anything, you may even find that your spirituality has strengthened your religious beliefs.
Better living through spiritual healing is our mantra here at Spirit Restoration. We wholeheartedly believe that anyone can find more meaning in their life as long as they are on the right path, and that path, for us, is spirituality.
Relax. Sit back. Listen to your spirit. It will tell you what you need.
In psychology, the ego plays a significant role in our psyche. It builds the foundation of our self-concept and is a crucial part of our cognitive function. However, the ego is seen as an obstruction in the spiritual path. A…

“Music washes away from the soul the dust of everyday life.“ Berthold Auerbach Music is the greatest creation man has ever made. It has the power to move us and free our souls. It’s the breathing of the earth and…
“My sacrifice, O God, is a broken spirit, a broken and contrite heart, you, God, will not despise.” Psalm 51:17 NIV We tend to discard things that have been damaged or perceived as useless. On the other hand, God loves…
New belief systems and movements that suit the mentality and philosophy of the modern world emerge as time passes. The most notable one is the rise of New Age Spirituality that spread during the 1970s and 80s. It emphasizes the…

Spirituality is a lifestyle — a personal commitment to life. It brings you closer to yourself and makes you more aware of the gifts you can share with the world. However, committing yourself to spirituality might be difficult if you…

“What you resist persists.” Carl Jung Spirituality is a sanctuary for people who want to find themselves and end their suffering. However, with the wrong perception of spirituality, it can be a prison rather than a place to ease your…

Aside from your physical, emotional, and mental wellness, spiritual health is also essential to your holistic well-being. Spiritual counseling guides individuals to relate their spiritual principles and beliefs to life events and situations. It is increasingly considered a remarkable tool…
When the stresses of modern life start taking a toll on your inner self, cultivating spirituality is one of the best ways to get ahold of your life again. Spiritual maturity is about developing self-awareness and knowing the ultimate truths…
Our connection with God is similar to our need for oxygen. He is our life provider— the giver of our purpose. He’s the light of our world and the master of our soul. He’s our compass when we get dragged…
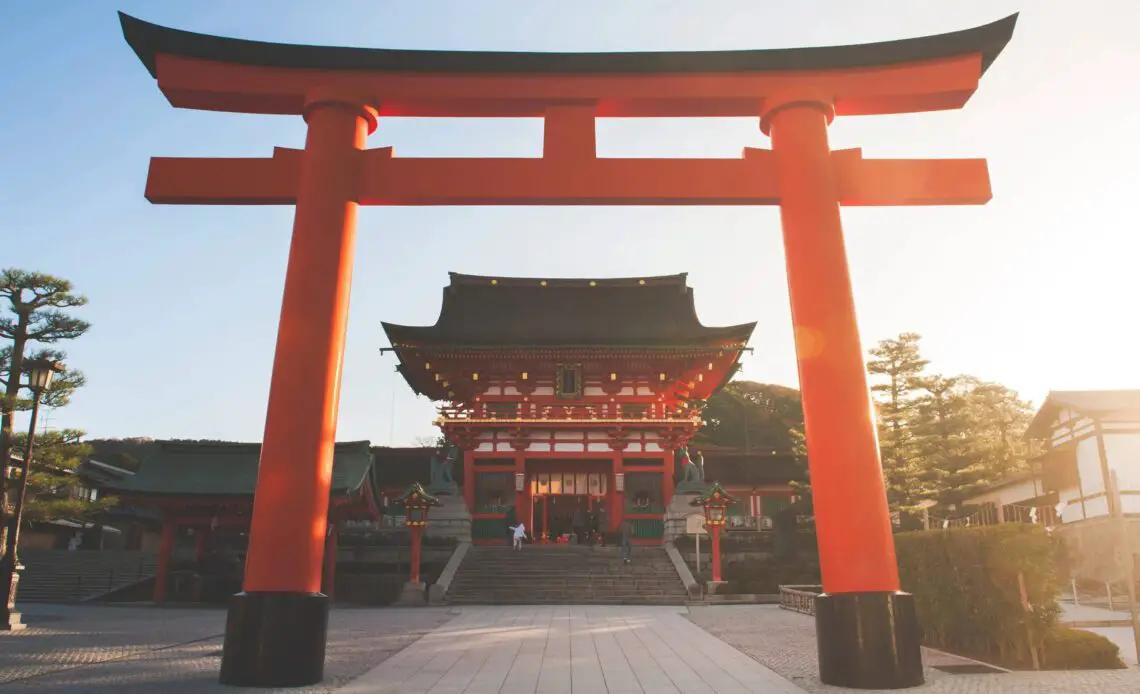
With almost 88 million followers, Shinto is the oldest belief system in Japan, coexisting alongside Buddhism. It has been deeply embedded in Japan’s heart and culture for thousands of years and highlights the importance of values, harmony with nature, and…